Table of Contents
You disabled JavaScript (or is it?)
1. Introduction
Hi all, my name is Arkan Asadil Huda, but you can just call me Arkan. I live in Purwokerto, Indonesia. My hobbies are amateur radio, programming, and experimenting. Of course, being an amateur radio enthusiast means I have a callsign: "YG2BXP" QRZ page. As a programmer, I can create various things, such as this website, practical or impractical Python code, Arduino code, and what not. You can find me here: Github: ArkanAtGithub Instagram: arkannn.h Discord: iamarkan
2. My Projects
Almost all of my projects are public and you can see them here:
2.1 OpenWebRX Receiver
Here is the description of the OpenWebRX from the OpenWebRX website:
OpenWebRX is a multi-user SDR receiver that can be operated from any web browser without the need for any additional client software.
It is the ideal solution to provide access to the HF spectrum at your location of choice to a wide audience.
All you need is a computer, an SDR device, and network access.
OpenWebRX aims to support as many modulations and encodings as possible, while still focusing on an easy-to-use interface,
so that even inexperienced users can explore the HF spectrum without the need to buy expensive radio equipment.
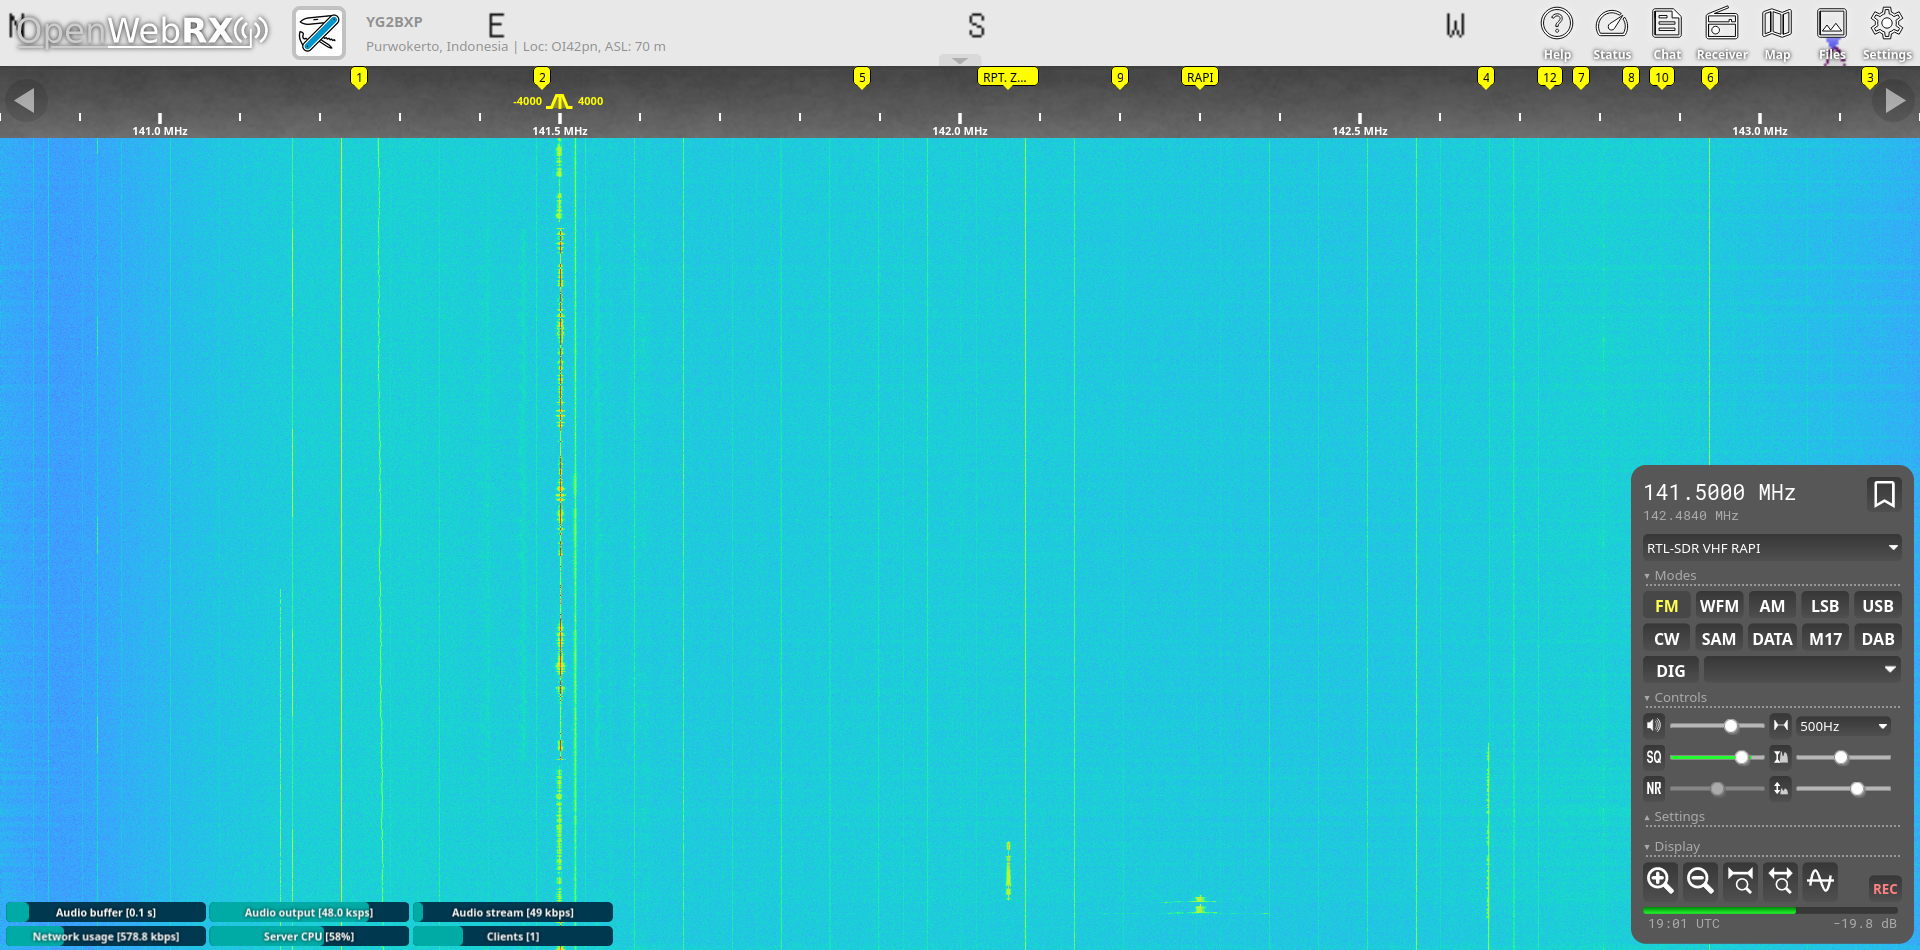
Although my OpenWebRX receiver cannot receive the HF spectrum, it still can receive VHF, UHF, and even Gigahertz signals!
And yes, I have a RTL-SDR Blog V4 that can do it, but that's for me :)
Anyway, you can see it here: owrx.thearkanlab.space

2.2 DIY Weather Station
DIY Weather Station, it's simple. You just need:
- ESP8266 or ESP32
- DHT11 or DHT22
- BMP280 or BME280
- Jumper cables
- Wi-Fi
- Programming skills
- Time
- Money
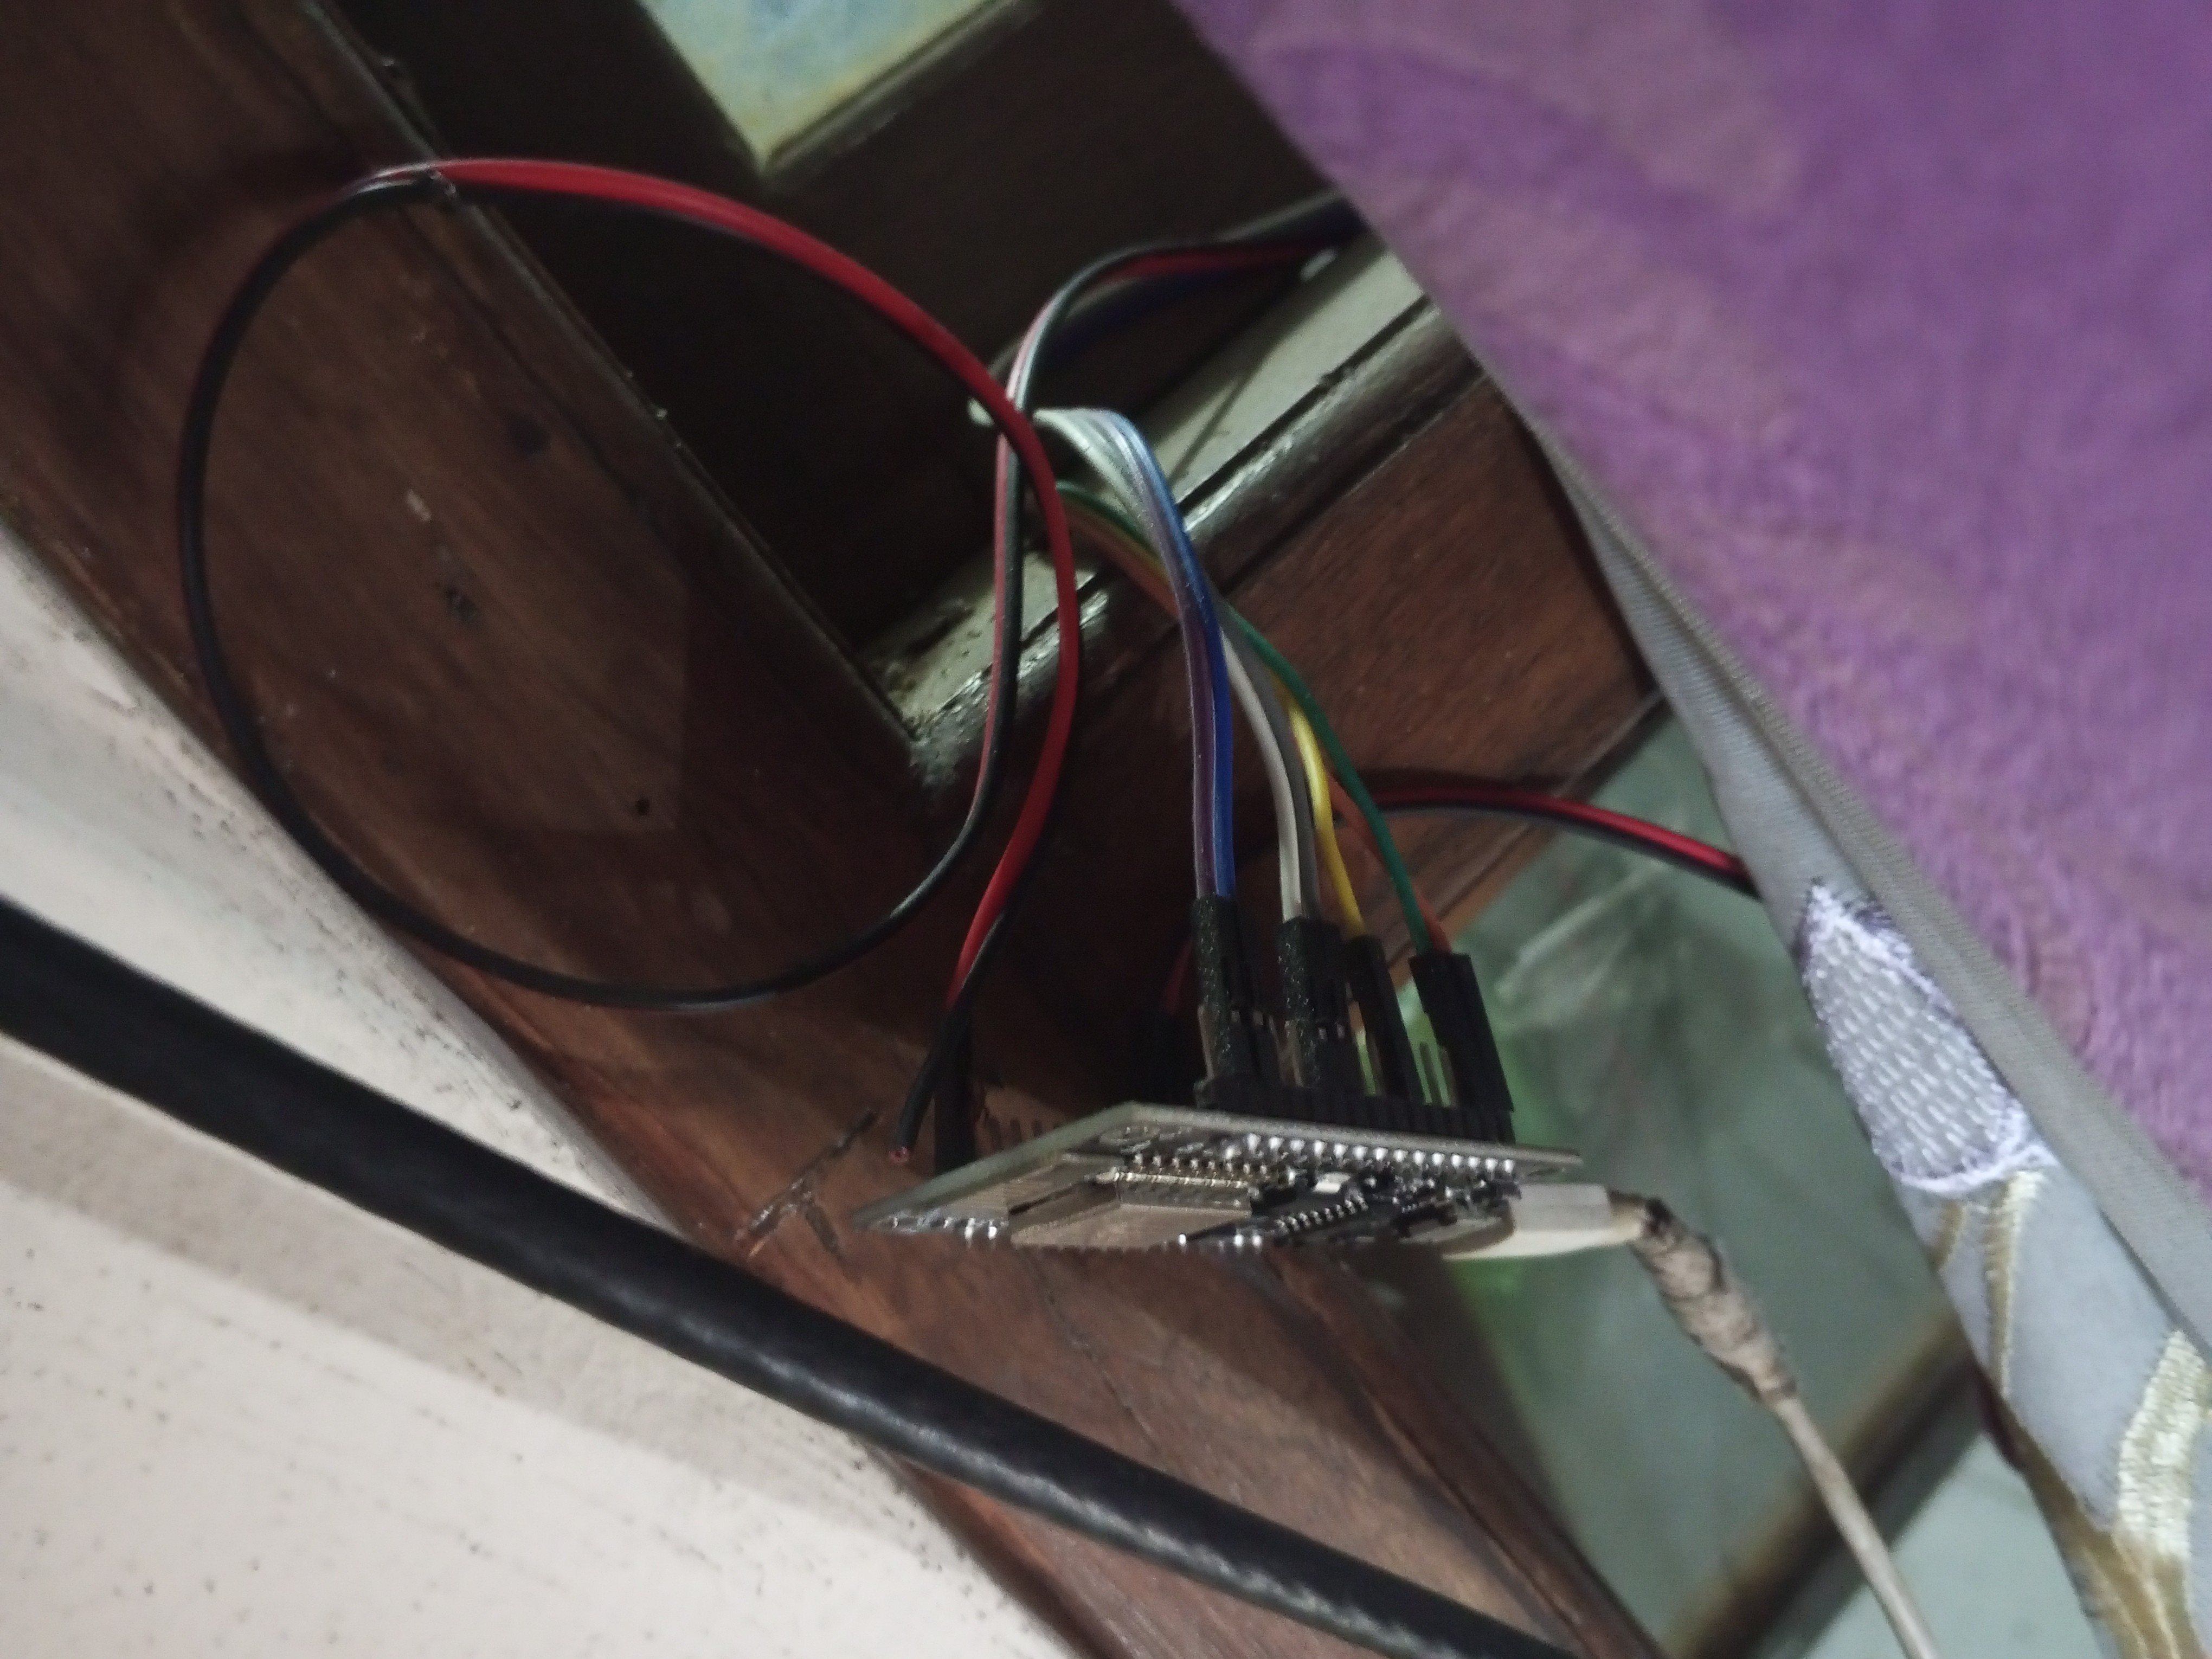
Ok... ok... I'm not here to teach you how to make it, but you get the idea.
1. I built it using ESP8266, DHT22, and BMP280 2. I created the code using the Arduino IDE 3. It works 4. Done
And here is the data and some info: on ThingSpeak or on my Grafana dashboard
Code: on Github

2.3 APRS-IS Wx (Weather)
Description about APRS-IS:
APRS-IS (Automatic Packet Reporting System-Internet Service) is the common name given to the Internet-based network which inter-connects various APRS radio networks throughout the world (and space).
APRS-IS is maintained and operated by volunteer Amateur Radio operators to provide world-wide capabilities to the Amateur Radio APRS RF networks and to promote the Amateur Radio service as a whole.
In short, APRS-IS is like a global network for sharing short bits of data from radios over the internet, making it easy for radio enthusiasts to share and access information from anywhere in the world.
That short bit of data can be location, altitude, status, telemetry, and even weather data such as temperature, humidity, rainfall, and pressure.
So I made a Python code that grabs the data from my InfluxDB server, processes it, and outputs it to the home directory for Direwolf to transmit the data to the APRS-IS server. and send it directly to APRS-IS server using aprslib library.
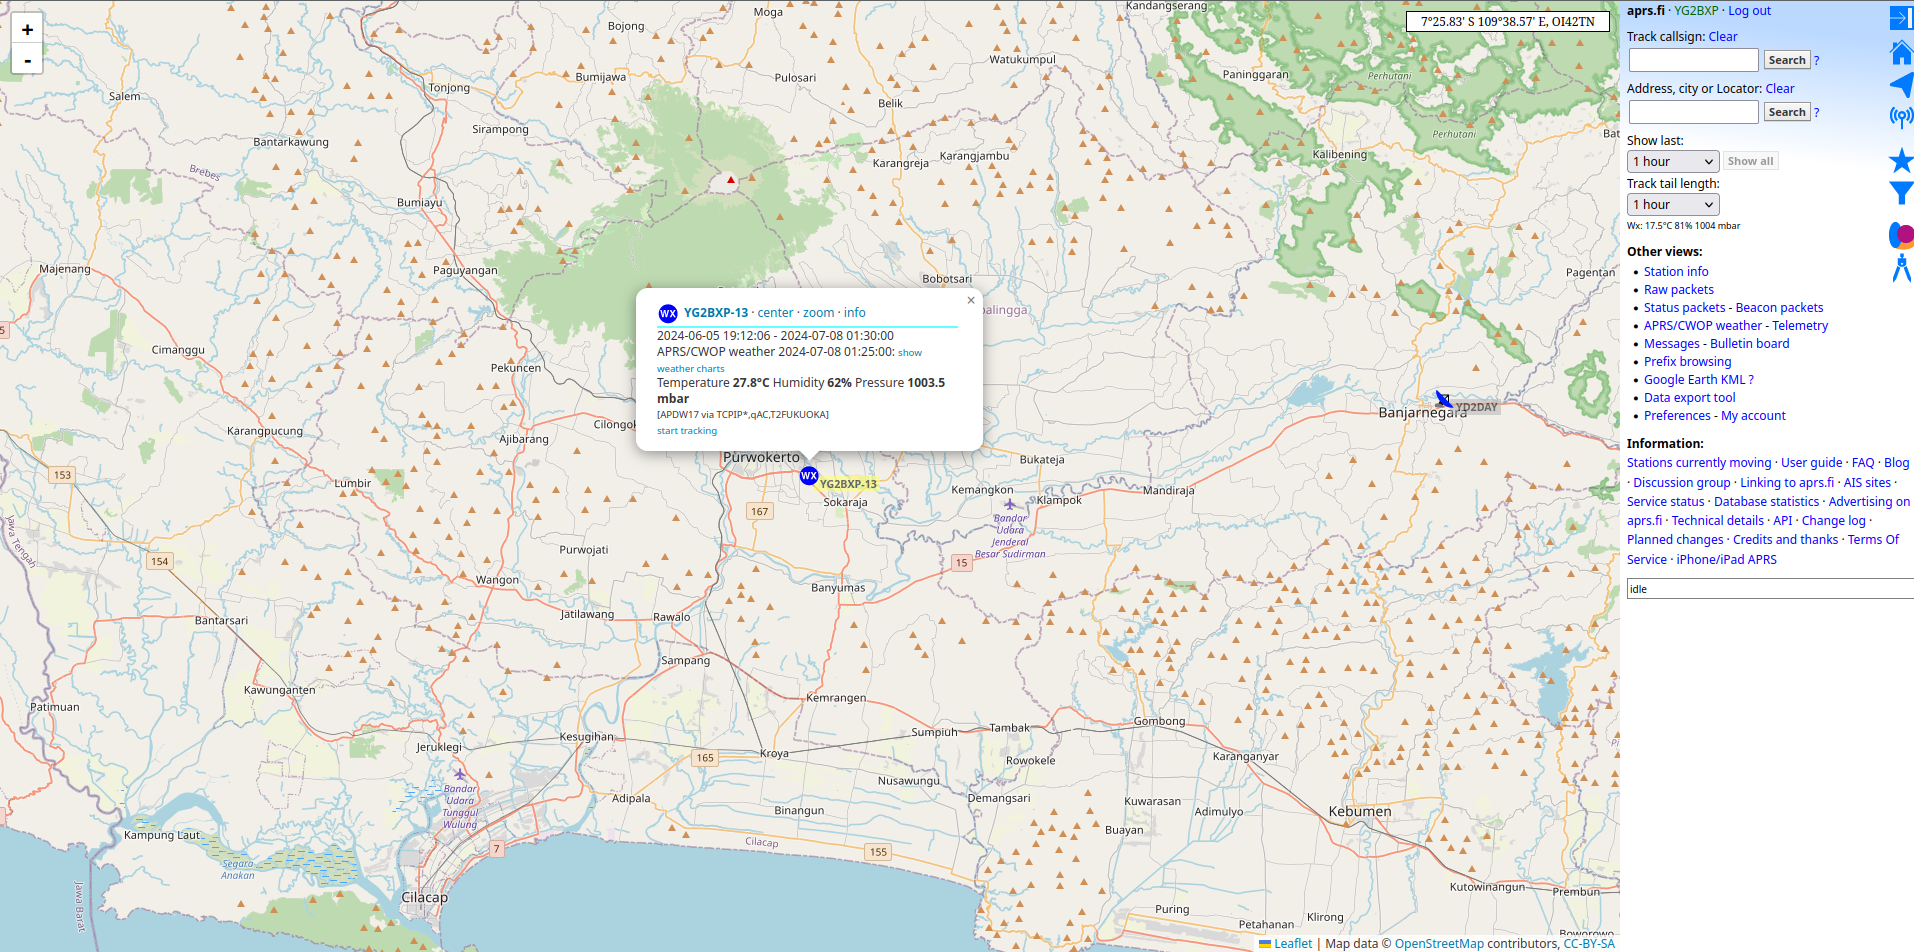
And here is the map view: on aprs.fi
Also weather history graphs for YG2BXP-13: on aprs.fi
APRS WX Protocol reference: Page 72
Direwolf wx-station technical documentation: Weather-Station.pdf

2.4 Grafana dashboard
Grafana dashboard everyone?
Grafana open source is open source visualization and analytics software.
It allows you to query, visualize, alert on, and explore your metrics, logs, and traces no matter where they are stored.
It provides you with tools to turn your time-series database (TSDB) data into insightful graphs and visualizations.
Grafana basically allows you to visualize data from your (or someone else) TSDB.
I have two TSDB
- Prometheus
- InfluxDB
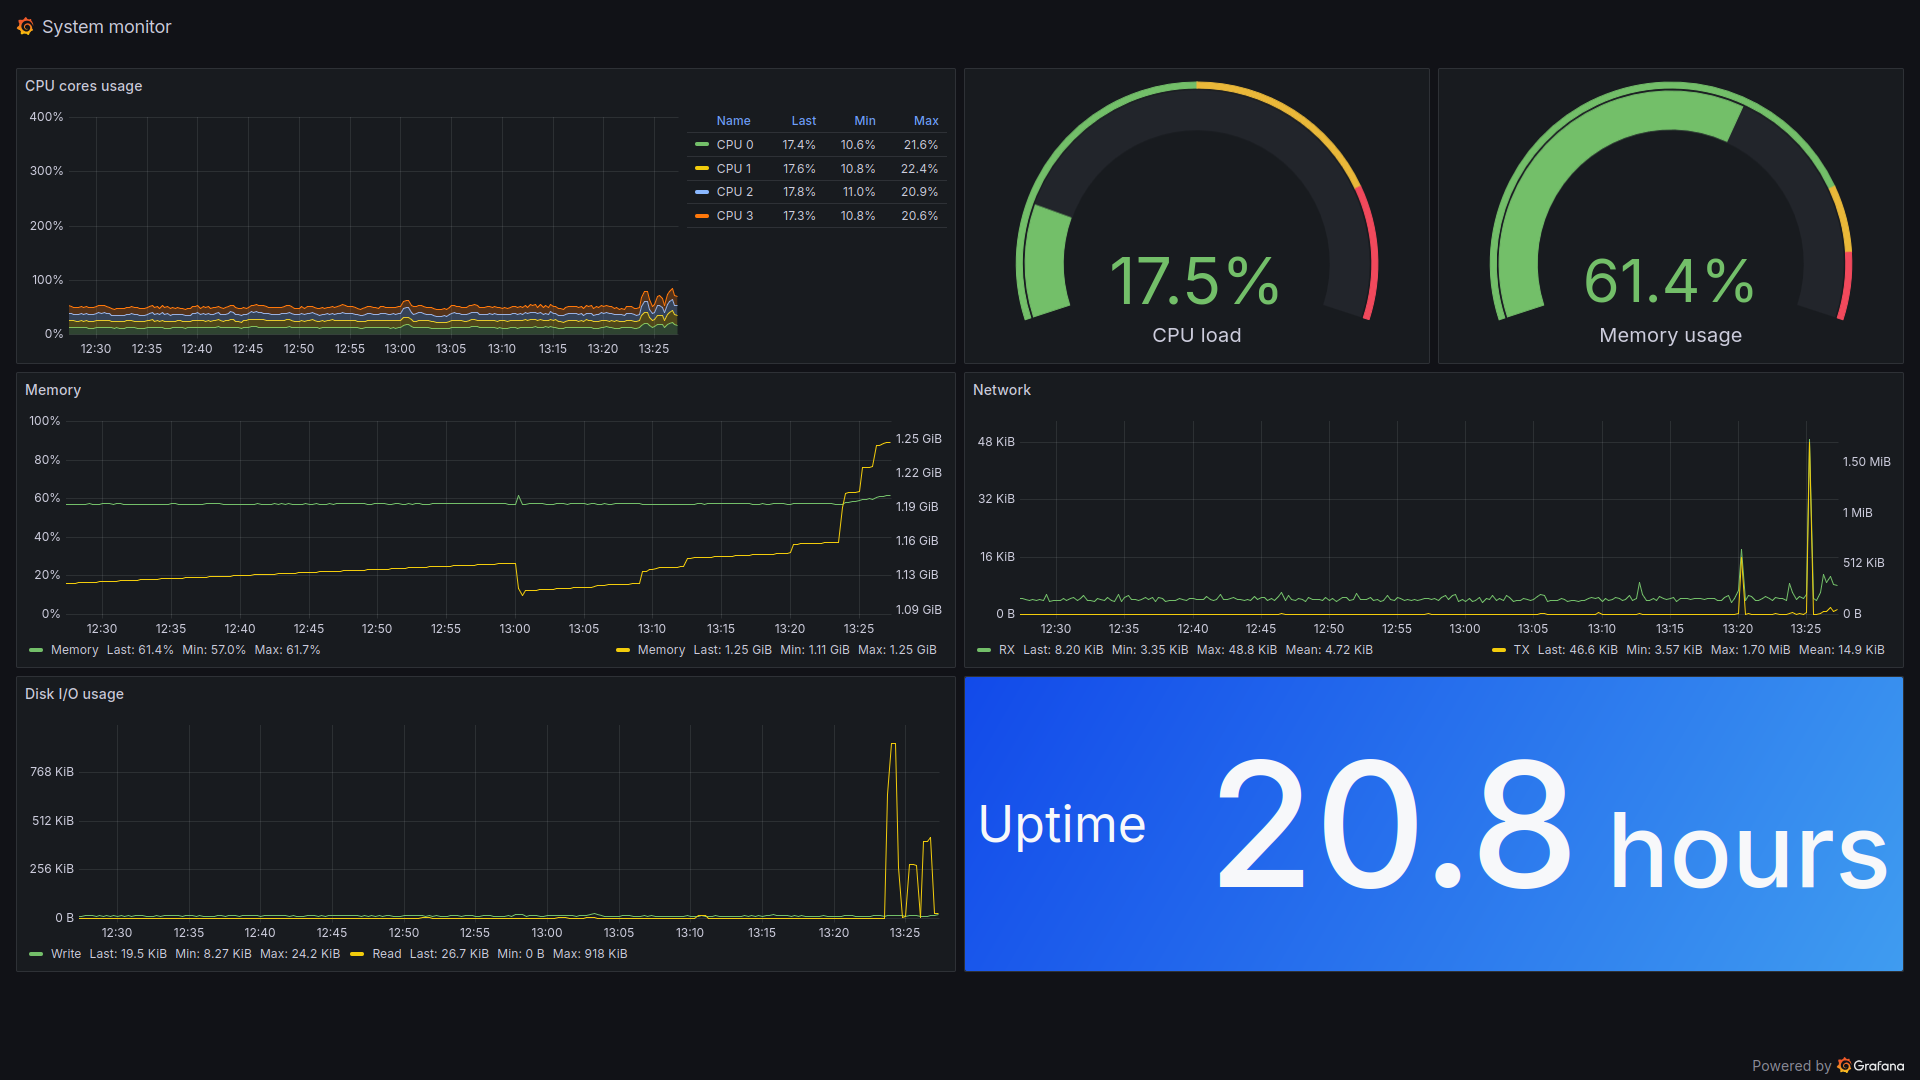
Prometheus for monitoring my server aka my laptop and InfluxDB for my IoT devices. here is the grafana dashboard:

3. TEST
"Nothing is more permanent than a temporary solution" -Said someone
That's it for now, thank you :3
Countdown for something: